JPY (¥)
Japanese yen
Current regime
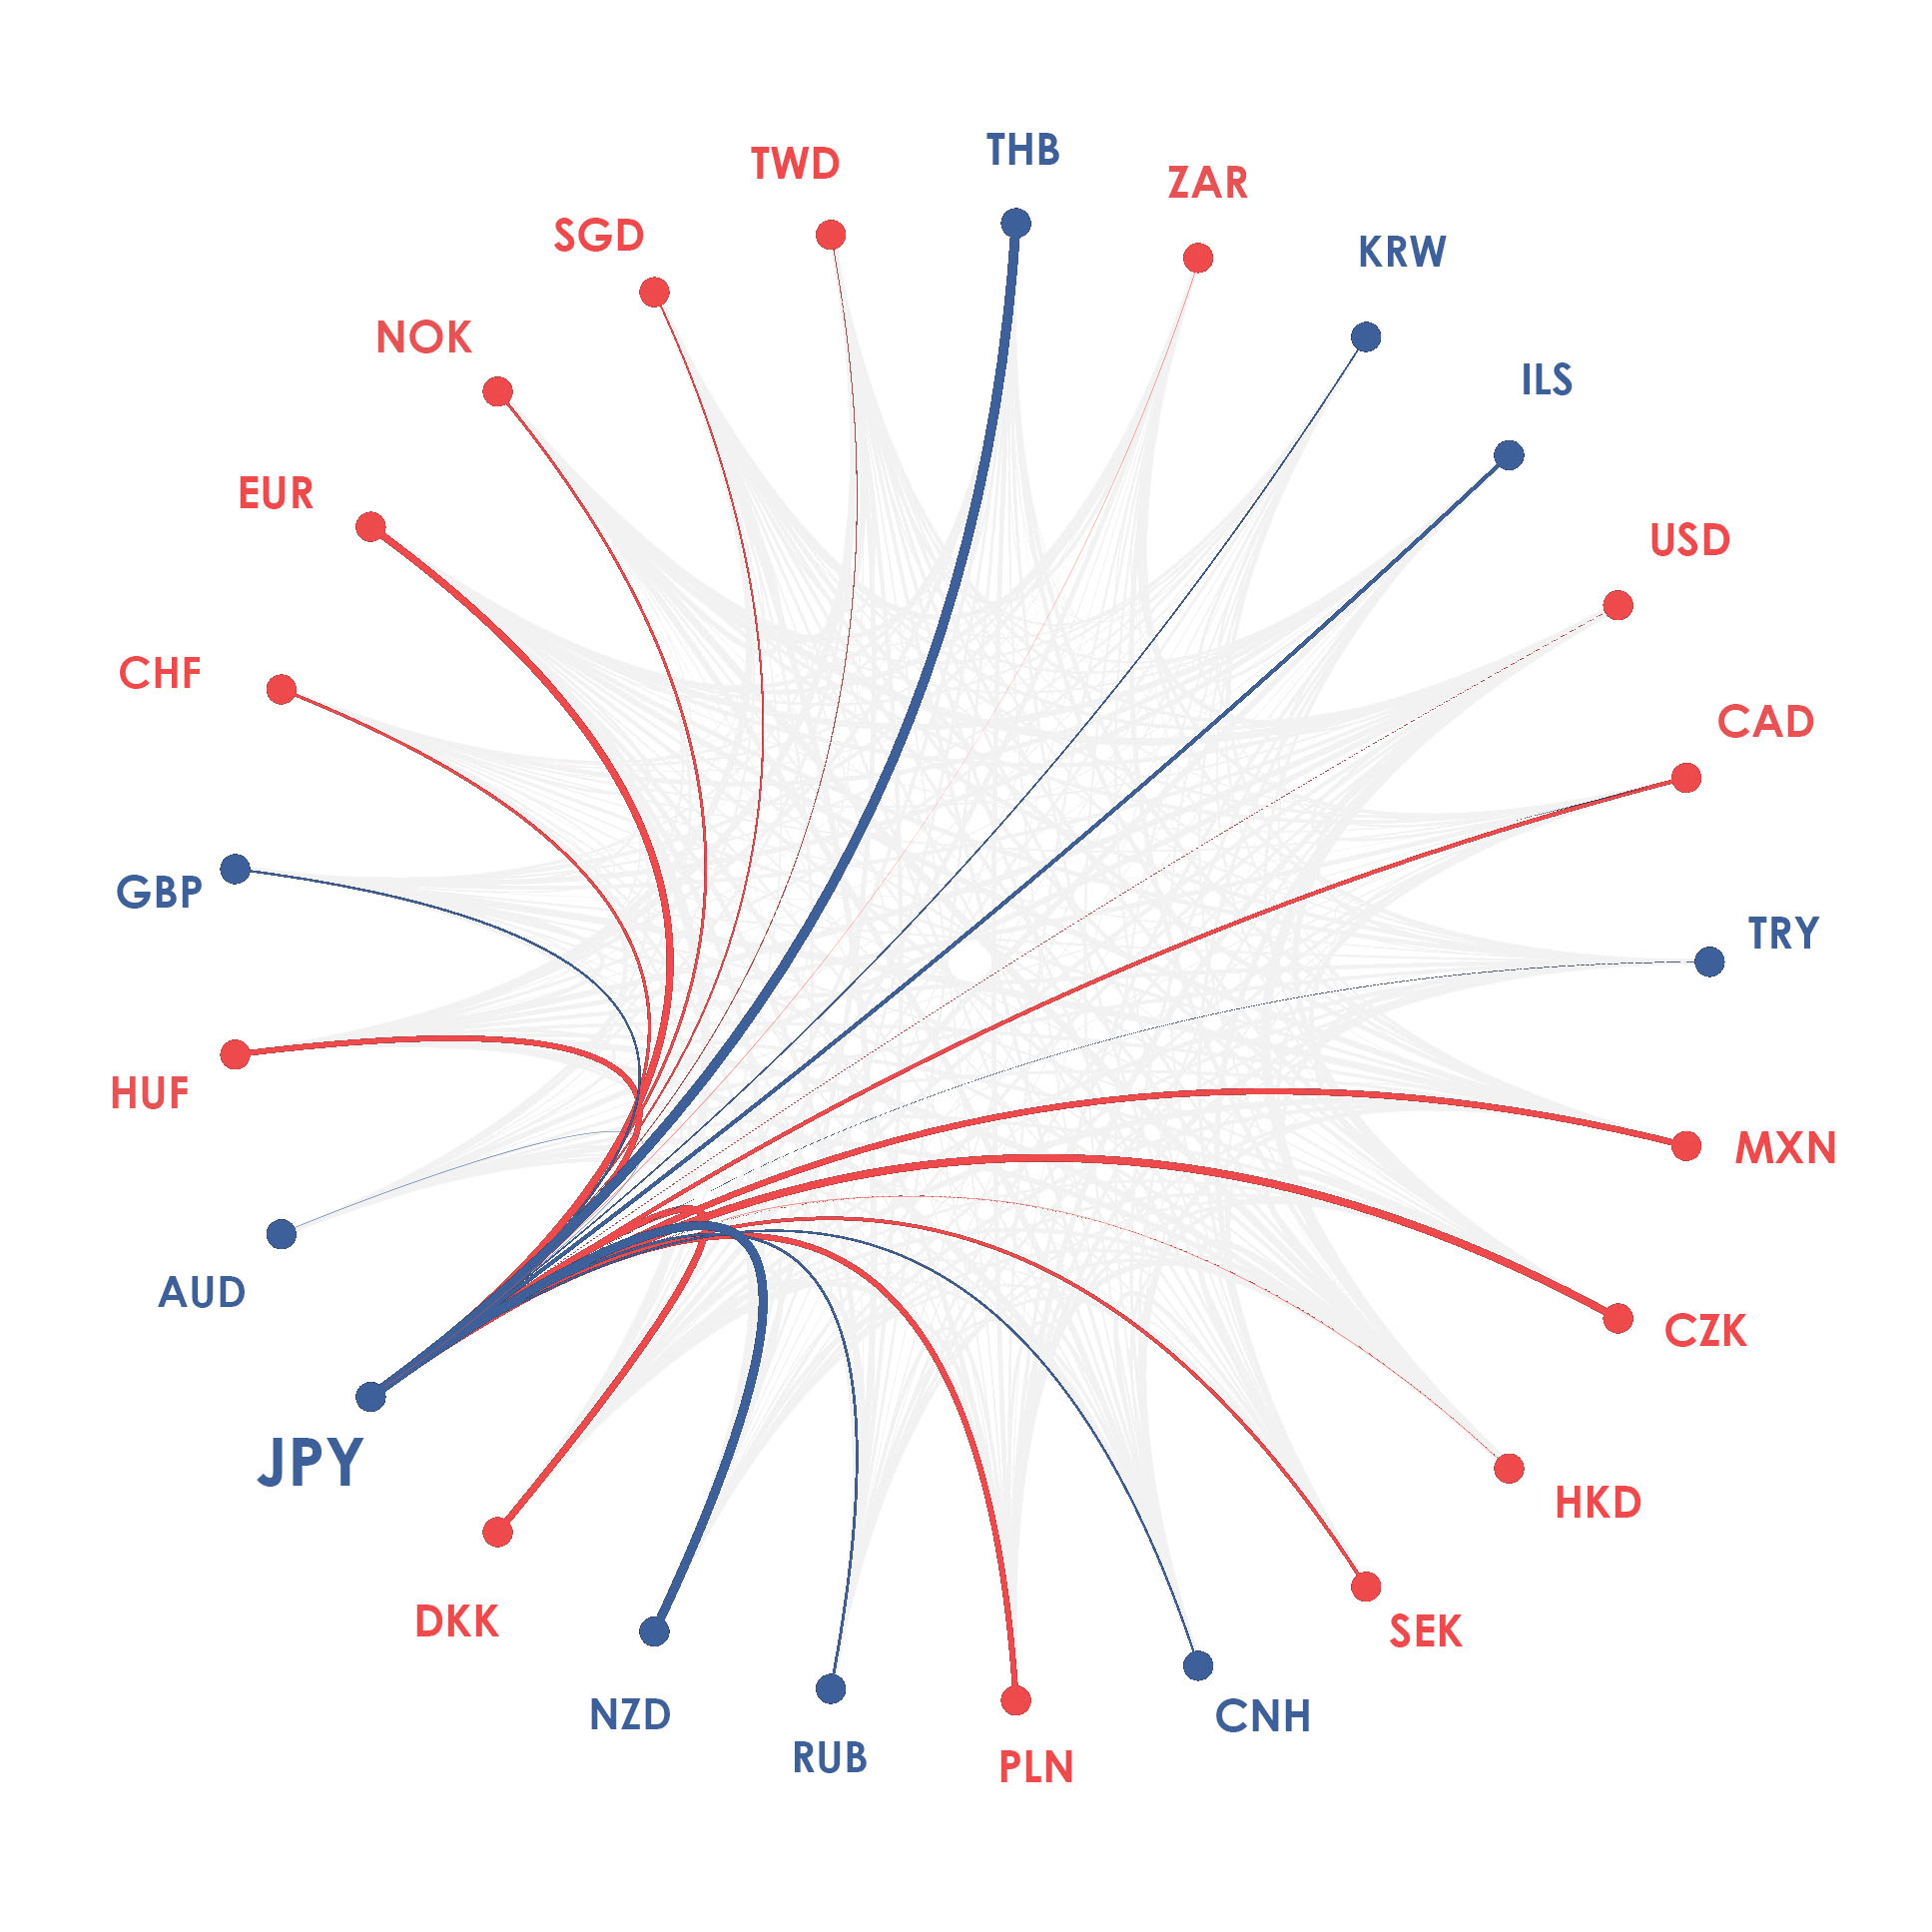
Trading the JPY between market participants and across borders is unrestricted and the market price is mostly determined without central bank intervention.
Highly standardised payment processing.
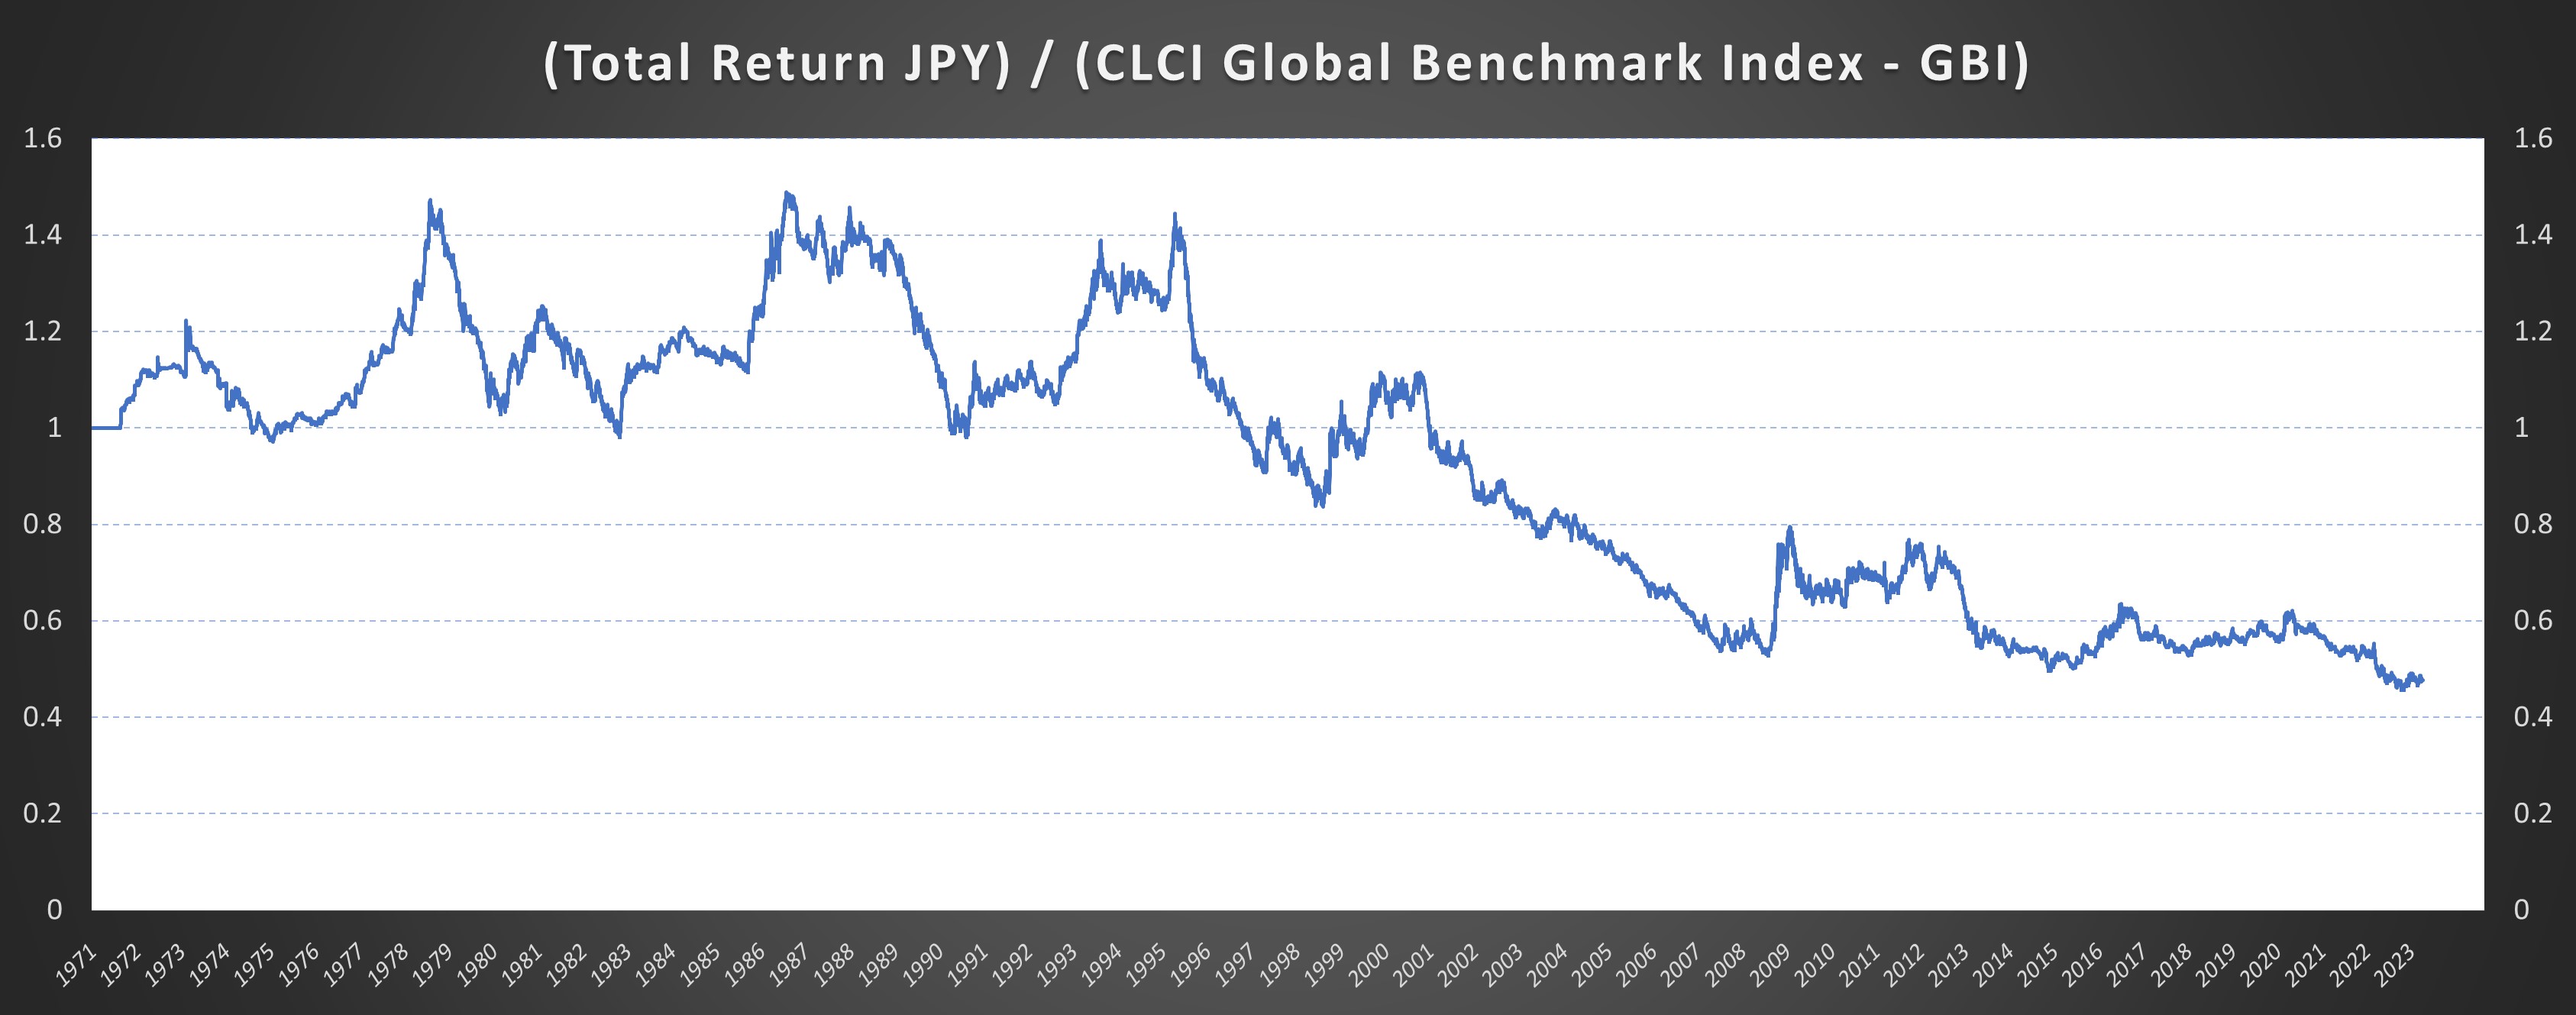
History
The JPY was introduced on 27 June 1871 to replace the Tokugawa monetary system of the Edo period based on the mon. The yen was legally defined as 0.78 troy ounces (24.26 g) of pure silver.
The JPY was placed onto the gold standard in 1897, fixing its USD value at 0.5 until Japan left the gold standard in 1931. This marked the beginning of a period of high inflation and instability in Japan and by 25 April 1949 when Japan was brought into the Bretton Woods System, the USD/JPY exchange rate was fixed at 360. This value was fixed until the demise of Bretton Woods in 1971 after the US ended USD gold convertibility.
The JPY was floated in early 1973 but has been subject to heavy central bank intervention at times.
The JPY accounted for 16.8% of global FX turnover in April 2019.
https://www.boj.or.jp/en/index.htm/