ZAR (R)
South african rand
Current regime
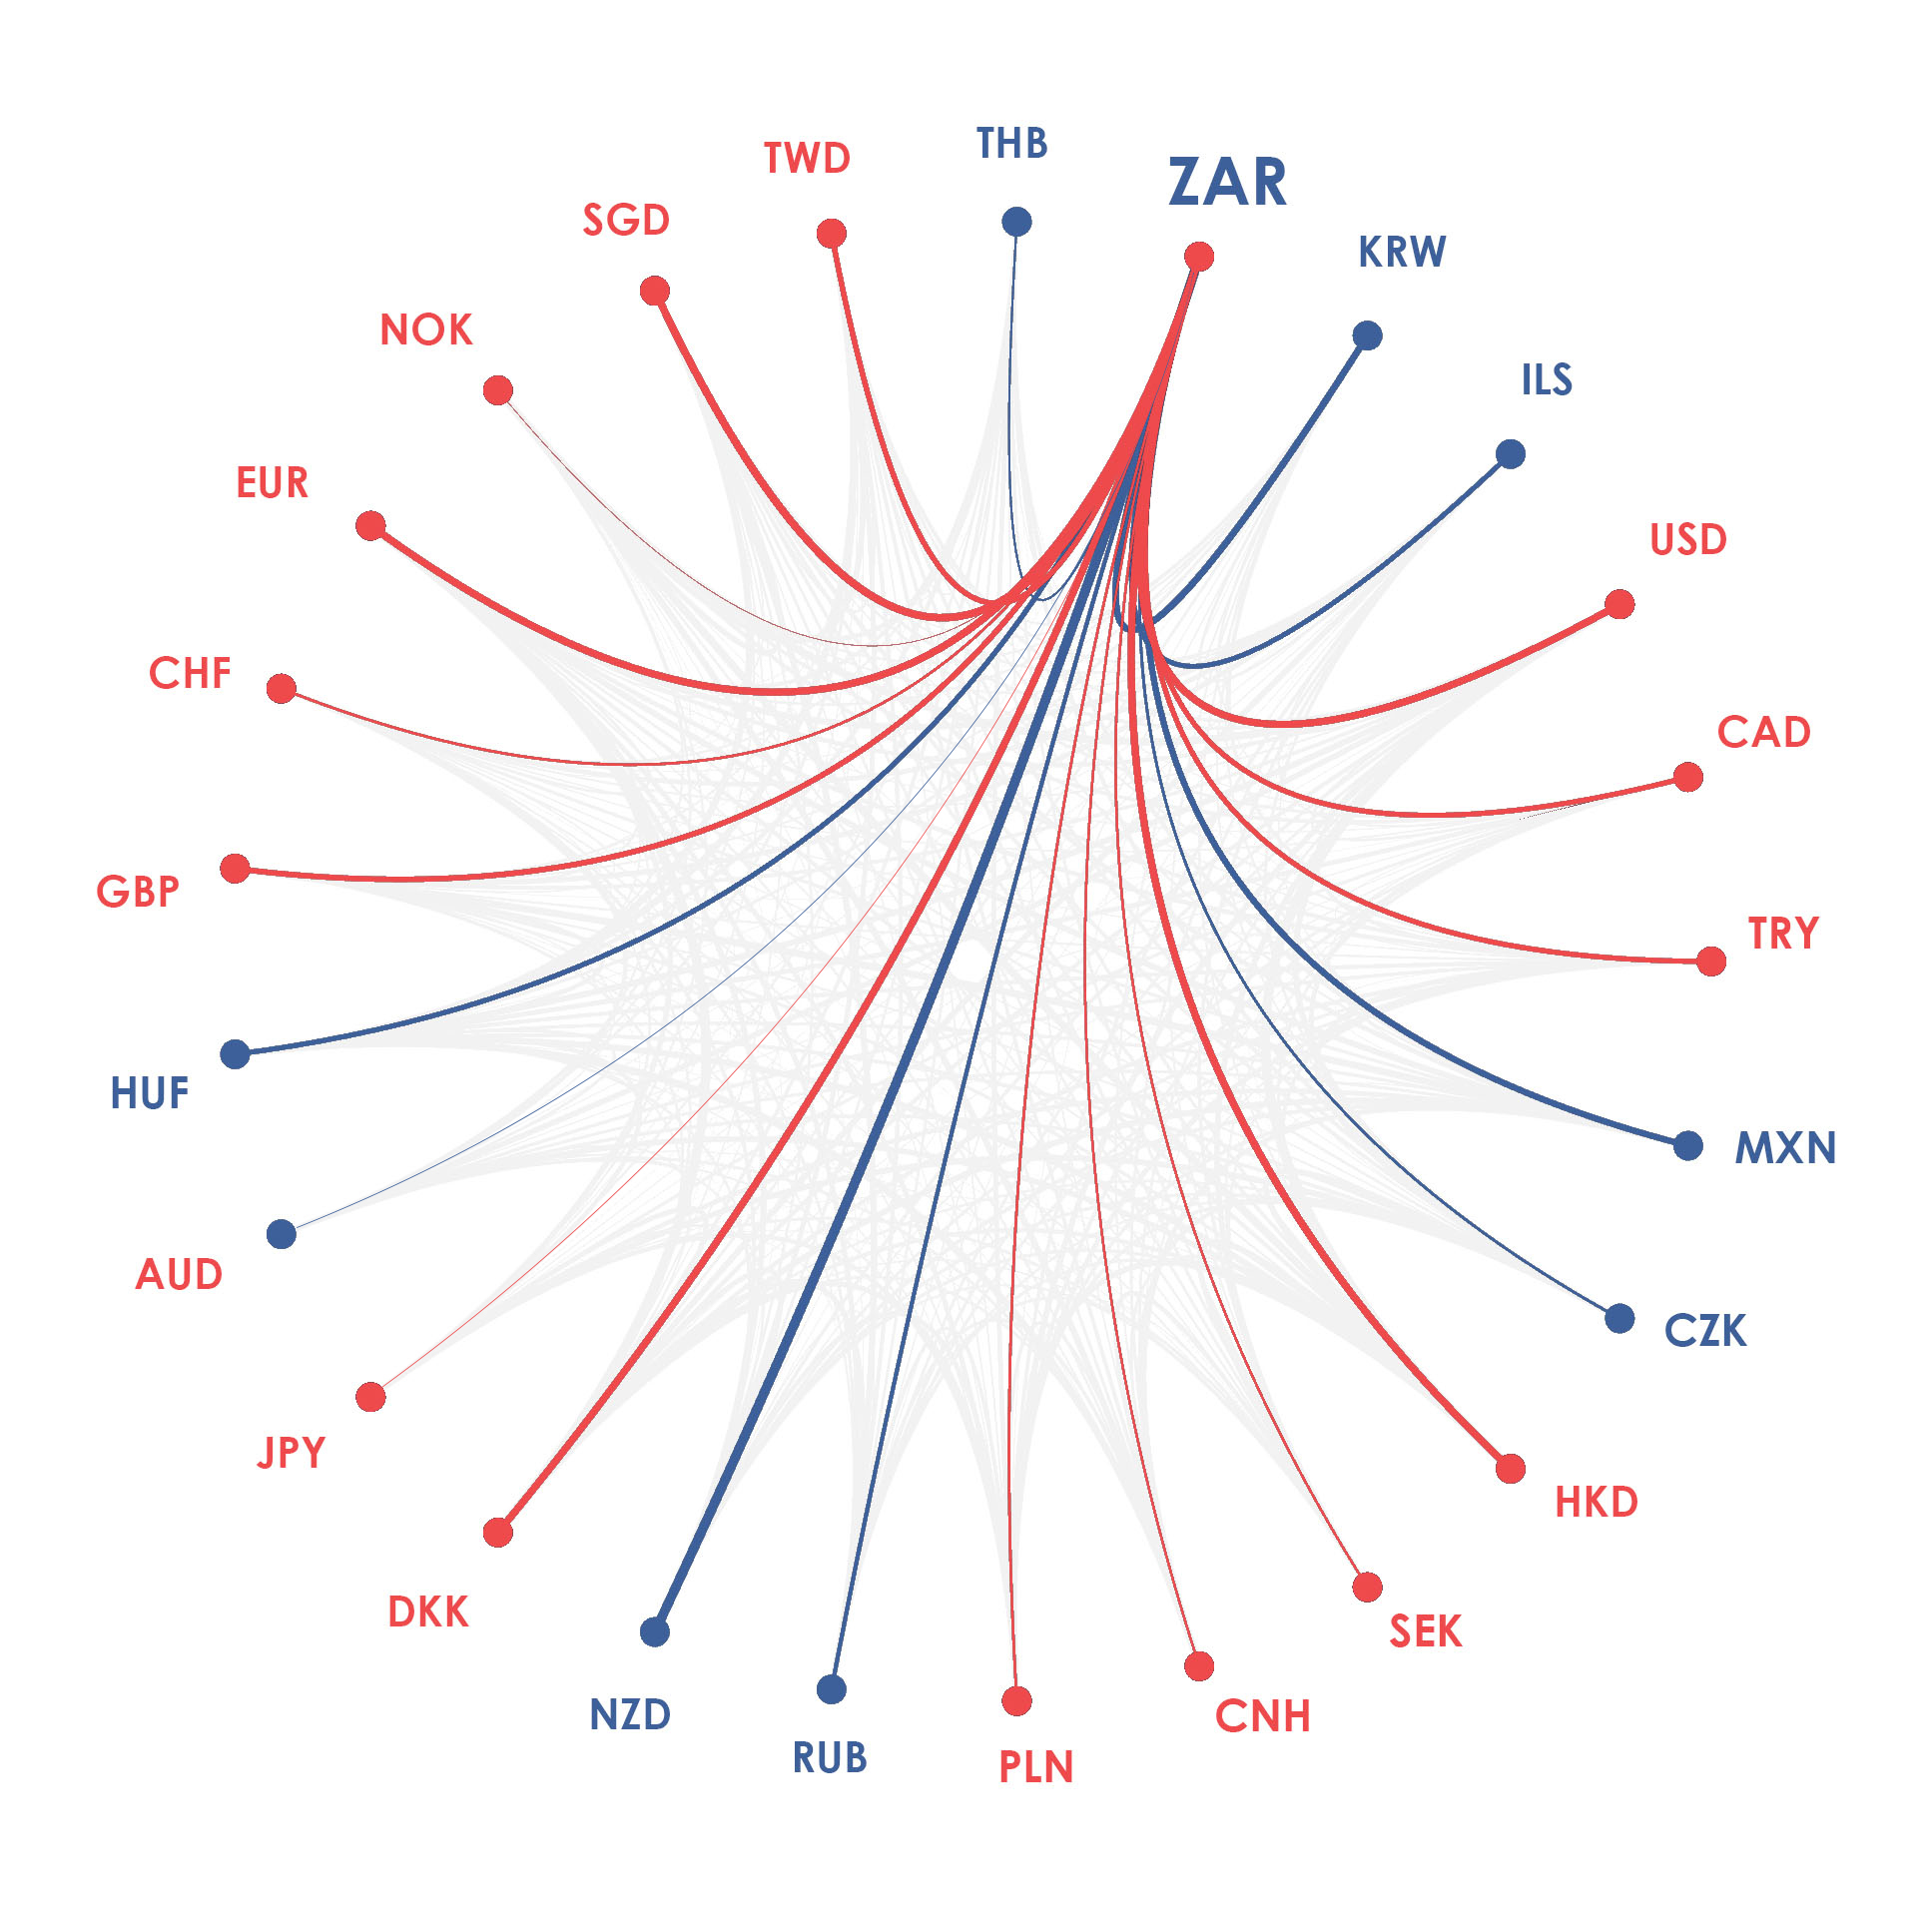
Trading the ZAR between market participants and across borders is unrestricted and the market price is primarily determined without central bank intervention.
Highly standardised payment processing.
History
The ZAR was introduced on 14 February 1961 to replace the South African pound at the rate of 2 rand to 1 pound.
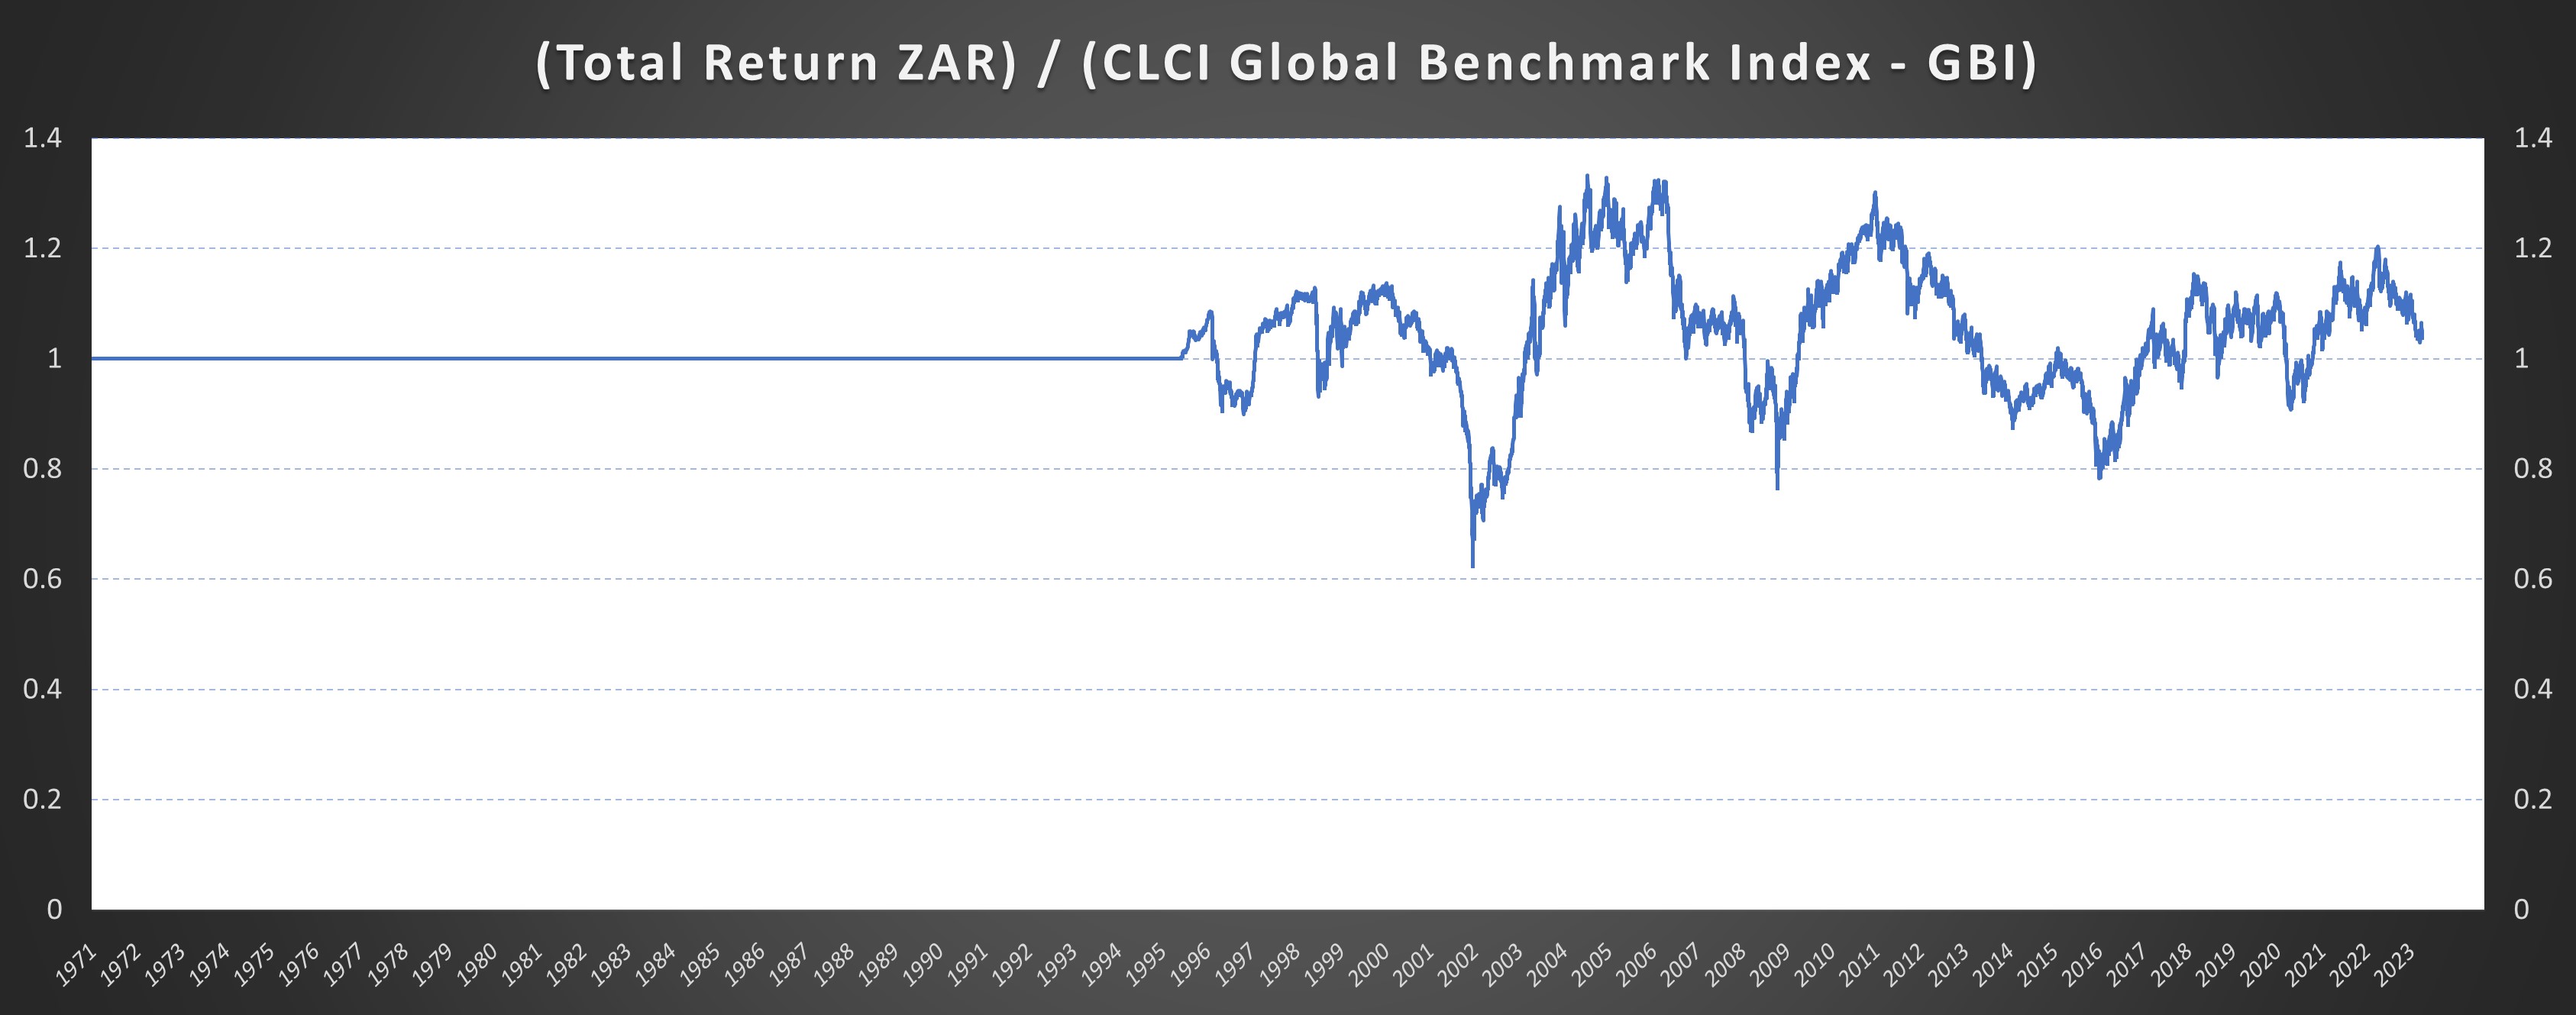
The ZAR was floated on 13 March 1995.
The ZAR accounted for 1.1% of global FX turnover in April 2019.
https://www.resbank.co.za/Pages/default.aspx